About visx
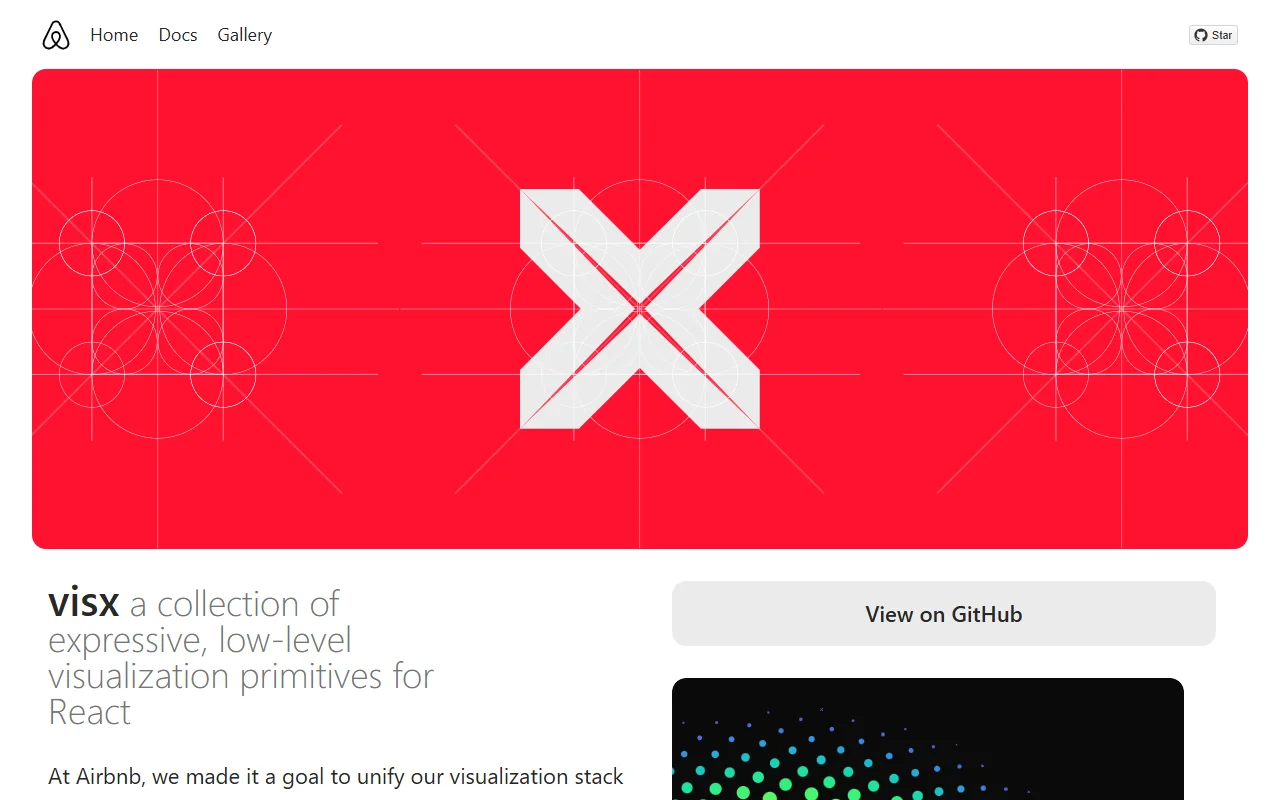
visx is a collection of low-level building blocks for data visualization in React. It was created at Airbnb and combines D3 with React components.
What it does
visx provides primitives such as shapes, layouts, scales and groups that you compose into your own charts. It is not a charting library with fixed chart types. You stay in control of the design, the state and the animation approach. The packages are split up, so you install only the parts you need.
Key features
- Split into packages, so you install only what you use
- Low-level primitives for shapes, layouts and scales
- Works with any state or animation library
- Plain React components with familiar patterns
- Gallery of examples to learn from
Who it's for
React developers and design-system teams who want custom charts with full control. It is a poor fit for teams that want a finished chart from a few lines of configuration.
Pricing and good to know
visx is open source and released under the MIT license, so it is free to use. Expect to write more code than with a ready-made charting library, since you assemble each chart yourself. The project does not include a visual builder.
Highlights
- Split into packages, so you install only what you use
- Low-level primitives for shapes and layouts
- Works with any state or animation library
- Plain React components with familiar patterns
- Gallery of examples to learn from