About Observable Plot
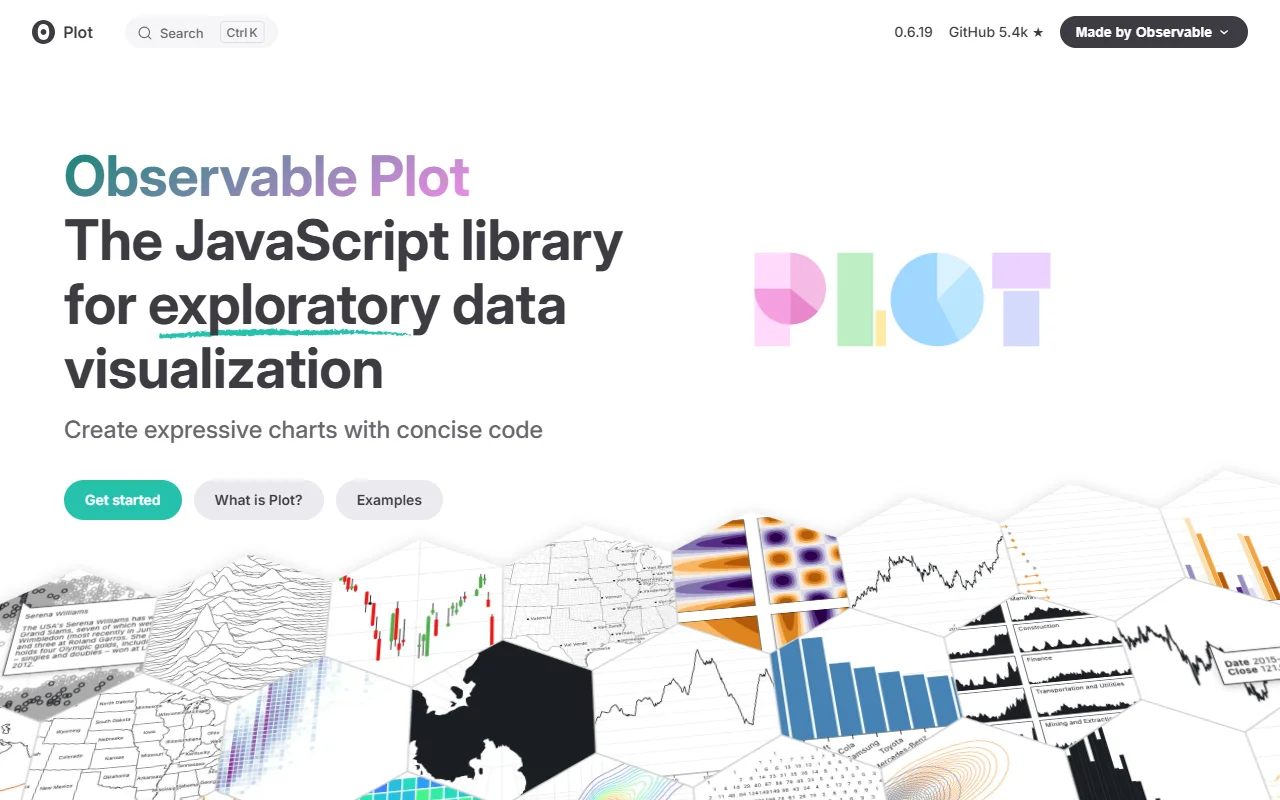
Observable Plot is a JavaScript library for exploratory data visualization. It describes a chart as layered marks such as dots, bars and lines, rather than as fixed chart types.
What it does
Plot maps data fields to visual channels through scales, then draws marks on top of each other. Transforms can bin values or compute rolling averages while the chart is drawn. Facets make small multiples, and projections support geographic maps. The library is built by the same team that makes D3.
Key features
- Layered marks such as dots, bars and lines
- Scales that map data to position and color
- Transforms for binning and rolling averages
- Facets for small multiples
- Geographic maps with GeoJSON projections
Who it's for
Data analysts, researchers and developers who explore data in code and want short, readable chart definitions. People who already know D3 will find it familiar.
Pricing and good to know
The Plot library is open source under the ISC license and free to use. Observable also runs a hosted platform for collaborative analysis, which is separate from the library. Check the official pricing page for the current plans of that platform.
Highlights
- Layered marks such as dots, bars and lines
- Scales that map data to visual channels
- Transforms for binning and rolling averages
- Facets for small multiples
- GeoJSON map projections