About Recharts
Recharts is a charting library for React made from reusable components. It draws charts as SVG and uses D3 submodules for the math.
What it does
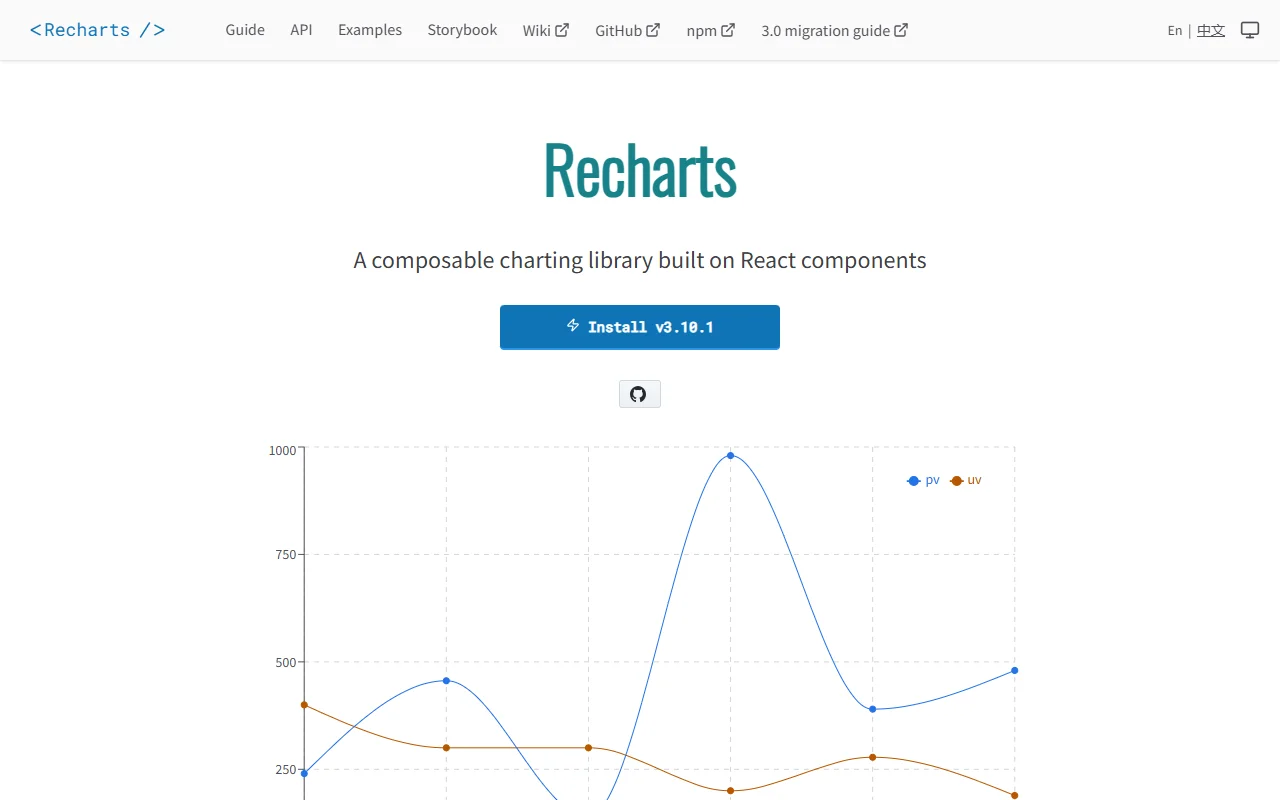
You build a chart by combining components such as a line chart, axes, a grid and a legend. Each piece takes props, so you can customize it or swap in your own component. It is often used alongside shadcn/ui and other React component sets.
Key features
- Composable components for line and bar charts
- SVG output that you can style with props
- Custom components for tooltips and shapes
- Light dependency footprint built on D3 submodules
- Devtools package for inspecting charts
Who it's for
React developers who want full control over chart markup and a simple way to start. It suits dashboards and admin panels where charts sit next to other interface elements.
Pricing and good to know
Recharts is open source and released under the MIT license, so it is free to use. Because each chart is built from React components, you need to know React to customize deeper parts of a chart. It renders in the browser, not on a server canvas.
Highlights
- Composable components for line and bar charts
- SVG output styled through props
- Custom tooltips and shapes
- Light dependency footprint
- Devtools package for inspecting charts