About Plotly.js
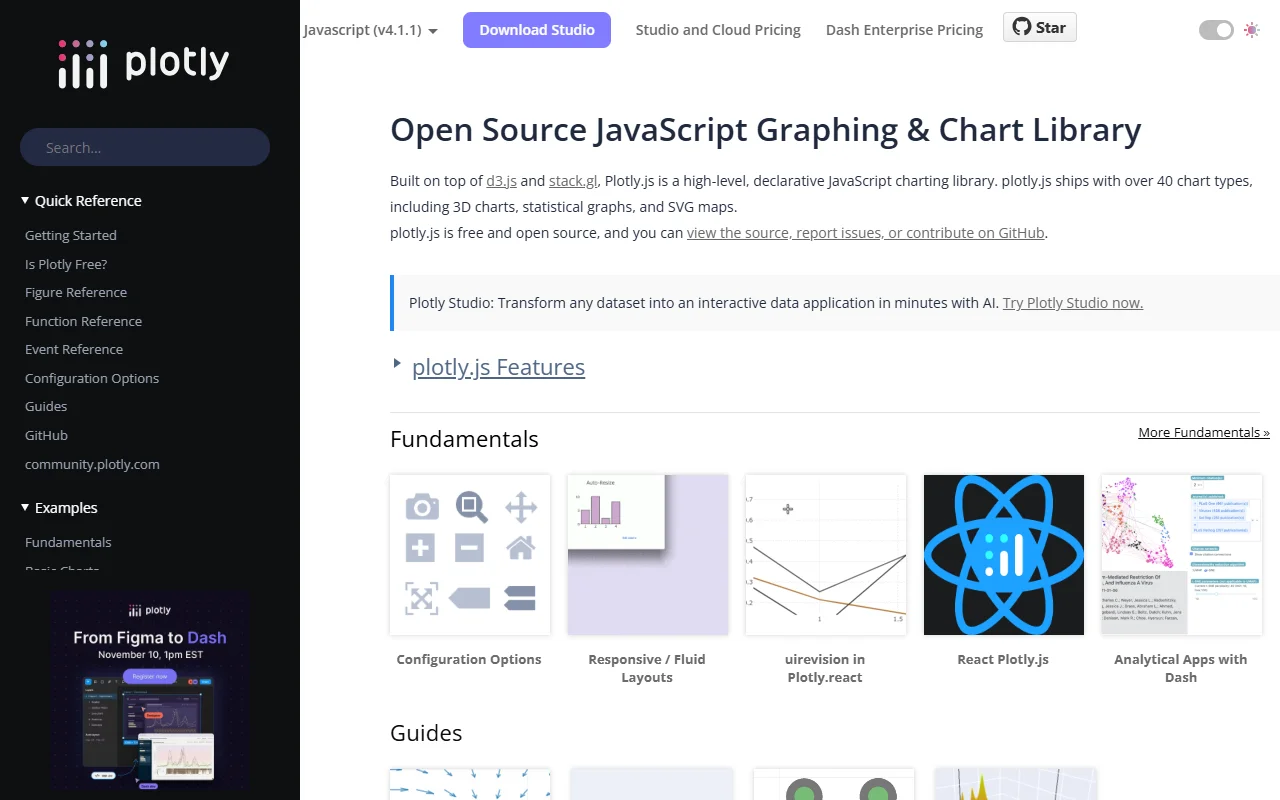
Plotly.js is an open source JavaScript library for interactive charts and graphs. It is built on d3.js and stack.gl and covers more than 40 chart types.
What it does
You describe a chart declaratively with data, layout and config objects. The library draws it in the browser with zoom, pan and hover interactions. It includes 2D statistical charts, scientific plots, financial charts, SVG maps and 3D charts.
Key features
- Over 40 chart types, including 3D charts
- Statistical plots such as box plots and histograms
- Financial charts such as candlesticks and waterfalls
- SVG maps and tile map layers
- Subplots, sliders and dropdown controls
Who it's for
Scientists, analysts and developers who need many chart types, including scientific and 3D plots, in one package. It is a good option for interactive research tools and internal analysis pages.
Pricing and good to know
Plotly.js is free and open source, and you can read its source on GitHub. Plotly's Studio and Dash Enterprise products are separate and have their own pricing. The library runs in the browser, and 3D charts need WebGL support.
Highlights
- Over 40 chart types, including 3D
- Box plots, histograms and statistical charts
- Candlesticks and waterfall financial charts
- SVG maps and tile map layers
- Subplots, sliders and dropdown controls