About Apache ECharts
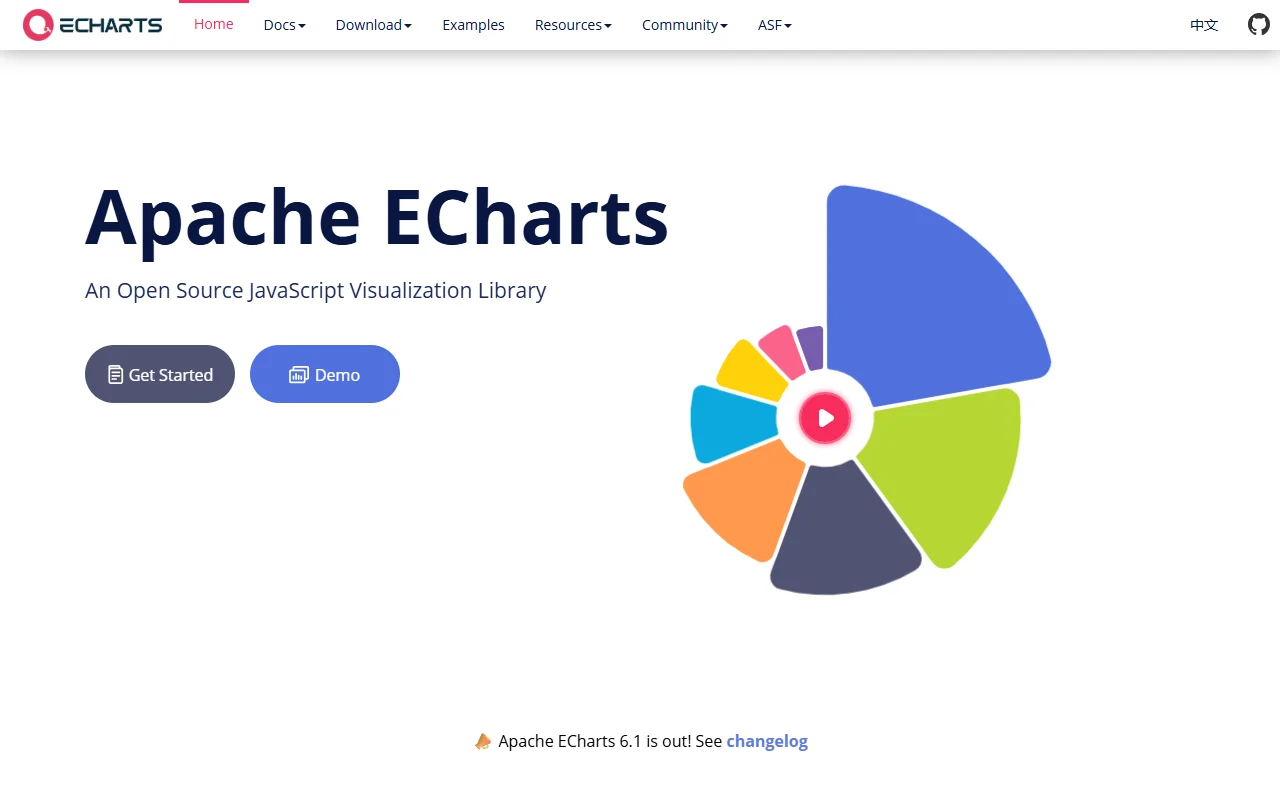
Apache ECharts is an open source JavaScript library for interactive charts and data visualizations. It is a project of the Apache Software Foundation.
What it does
ECharts builds charts from a declarative configuration object. It offers more than 20 chart types, along with components such as legends, axes and tooltips that can be combined. It can render with canvas or SVG, and it handles large datasets with progressive rendering.
Key features
- More than 20 chart types out of the box
- Switch between canvas and SVG rendering
- Dataset transforms for filtering and clustering
- Automatic chart descriptions for accessibility
- Decal patterns to tell data series apart
Who it's for
Developers and analysts who need many chart types in one library, including large datasets and dashboards. It also suits teams that want built-in accessibility features for their charts.
Pricing and good to know
ECharts is free to use under the Apache-2.0 license. The project publishes a changelog and a set of examples to start from. It runs in the browser as a JavaScript library, so no hosted service is needed to draw charts.
Highlights
- More than 20 chart types
- Canvas or SVG rendering
- Dataset transforms for filtering and clustering
- Automatic chart descriptions
- Decal patterns for data series