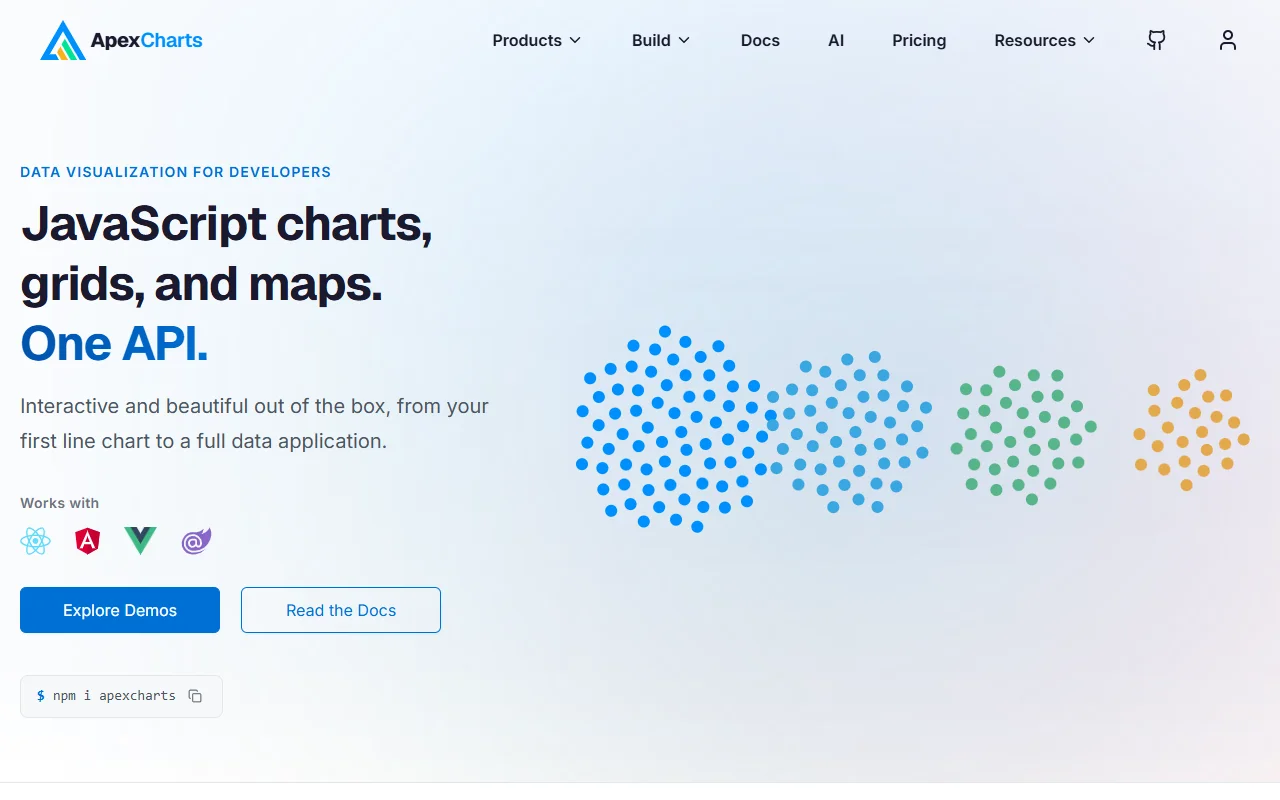
About ApexCharts
ApexCharts.js is a JavaScript charting library for interactive charts and dashboards. It is part of a wider family of chart and map products from the same team.
What it does
You create a chart by passing a configuration object with series, labels and options. The library draws line, bar, area and other chart types, and it renders them interactively out of the box. The team also offers an MCP server and skill files that help AI coding tools produce valid chart configurations.
Key features
- Interactive charts that look good out of the box
- Simple configuration object for each chart
- Map charts in the wider ApexCharts family
- Dashboard layouts that combine several charts
- MCP server to validate configs for AI assistants
Who it's for
Developers and product teams building dashboards, reports or analytics pages. It also suits people who want an AI assistant to write chart code that is checked against the real API.
Pricing and good to know
The site lists a pricing page for its wider product family, so check it for current plans before commercial use. The library is installed from npm and runs in the browser. Read the documentation for the full set of chart options before you rely on a specific feature.
Highlights
- Interactive charts that look good by default
- Simple configuration object for each chart
- Map charts in the wider product family
- Dashboard layouts with several charts
- MCP server to validate AI-written configs