
About Flourish
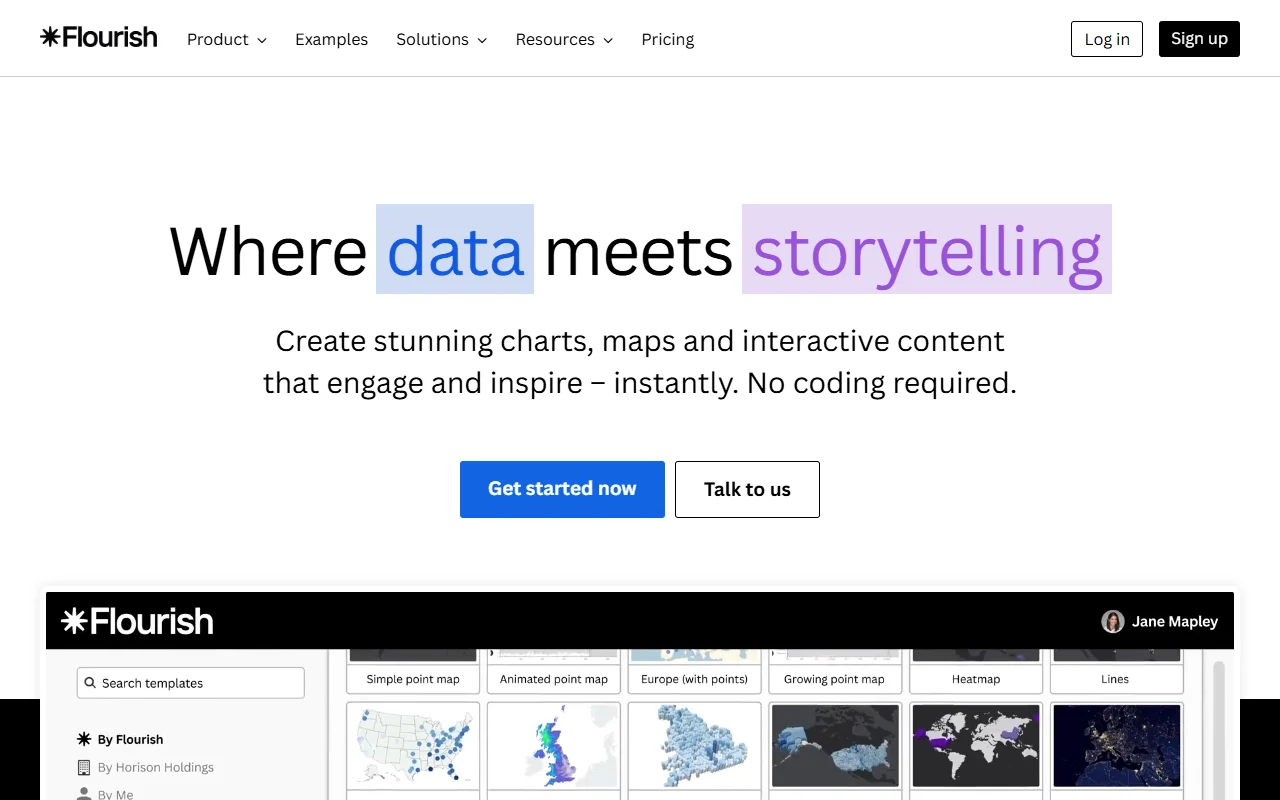
Flourish is a web tool for building interactive charts, maps and data stories without code. Results can be embedded on websites or shared in presentations and reports.
What it does
You import a spreadsheet or data file, pick a chart template and adjust the design. The output is interactive, so viewers can hover over values, filter the data and explore the story at their own pace. Templates cover everything from simple bar charts to longer scrolling narratives.
Key features
- Create charts and maps without coding
- Import data from spreadsheets and files
- Embed visuals on websites and in reports
- Use templates for scrolling data stories
- Keep colors and fonts consistent across a team
Who it's for
Journalists, marketers, educators and analysts who want polished interactive visuals quickly. Teams that need brand control can set shared styles, and newsrooms use it to publish data-driven stories alongside articles.
Pricing and good to know
Flourish offers plans through its website, and you can sign up and browse examples before choosing one. Check the current options for team features and export settings. Visuals are hosted by the service when embedded, so review that before you use sensitive data.
Highlights
- Create charts and maps without coding
- Import data from spreadsheets and files
- Embed visuals on websites and in reports
- Use templates for scrolling data stories