
About Infogram
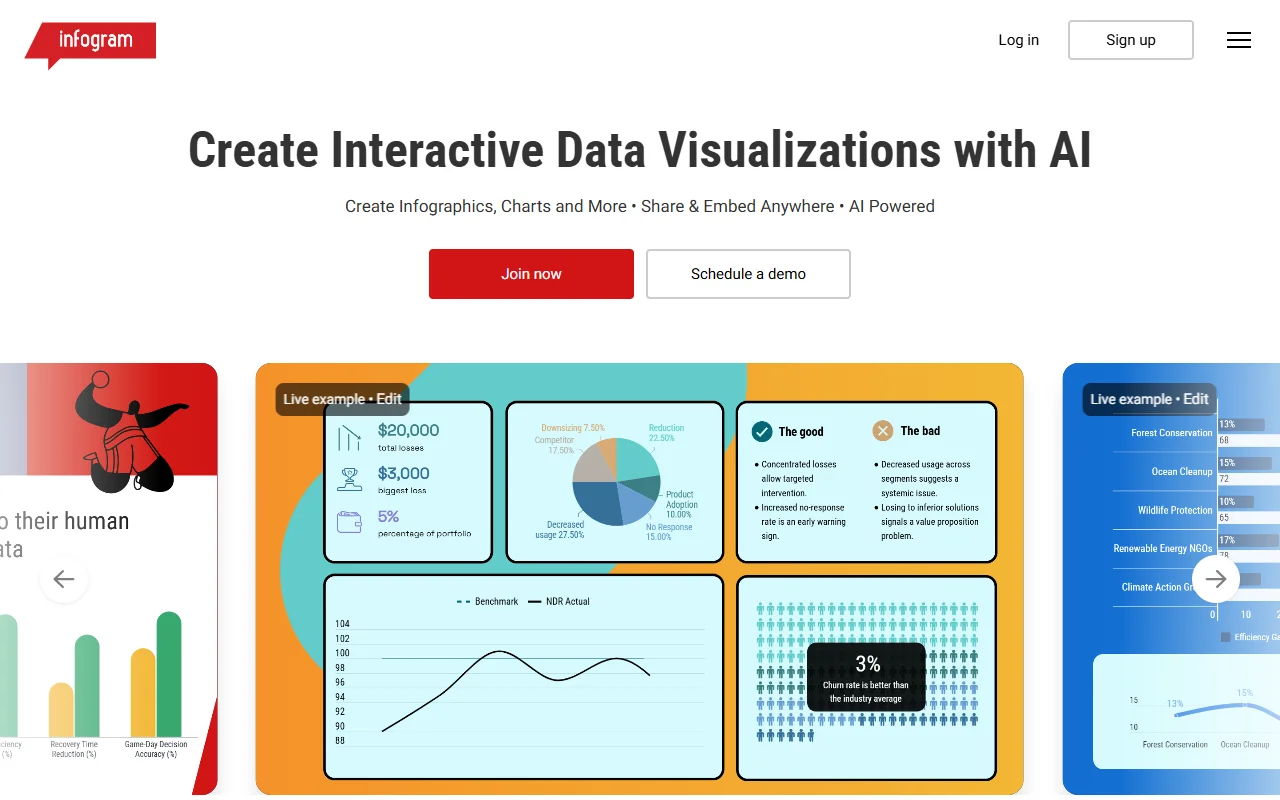
Infogram is an online tool for making charts, infographics and interactive reports. It suits people who want visuals that readers can explore rather than static images.
What it does
You start from a template or a blank canvas, add your data and adjust the design. Visuals can include tooltips, clickable parts and simple animation. Once finished, a project can be shared with a link or embedded in a web page, blog or slide deck, and it updates when you edit the source.
Key features
- Templates for infographics, reports, dashboards and slides
- Interactive elements such as tooltips and clickable parts
- Embed or share visuals without writing code
- Large library of chart types and maps
- Brand styling for colours and fonts
Who it's for
Writers, marketers, researchers and managers who need to present numbers in a clear and engaging format. It works well for articles, social posts and internal presentations that need a polished look without a designer on hand.
Pricing and good to know
The service has a free plan and paid plans that add more projects, branding options and team features. Visuals are built in the browser and published through Infogram's own hosting. If you plan to use custom branding or many projects, compare the plan limits on the pricing page first.
Highlights
- Infographics, charts and reports from ready made templates
- Tooltips, clickable parts and simple animation
- Embed or share a link to each finished project
- More than 35 chart types and 800 maps
- Brand colours and fonts applied across projects