About RAWGraphs
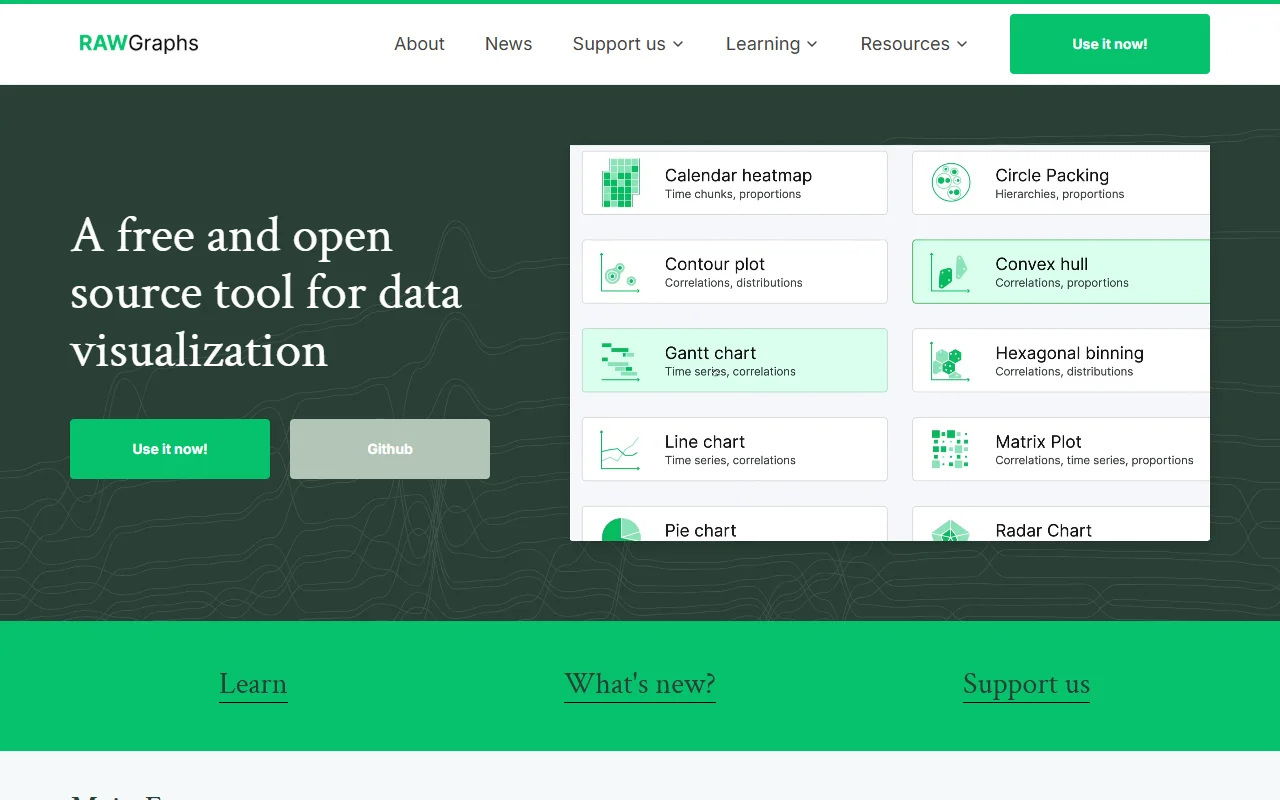
RAWGraphs is a free, open source web app for turning tabular data into charts. It fills the gap between a spreadsheet and a finished data visualization, and it is aimed at designers and researchers.
What it does
You paste or load a table, then map its columns to the visual variables of a chart. The app offers a wide range of chart models, from simple comparisons to hierarchies and time series. The result can be refined and exported as an image, so it can be edited in a design program afterwards.
Key features
- Almost thirty chart models for quantities and hierarchies
- Column mapping that controls how data is drawn
- Export charts as vector or raster images
- Save a project and come back to it later
- Source code available on GitHub under Apache 2.0
Who it's for
Designers, data journalists and researchers who want to explore a dataset visually and then polish the result in other tools. It is less suited to people who need live connections to databases or automated dashboards.
Pricing and good to know
RAWGraphs is free to use and its code is open source. The project states that your data is processed only by your own browser, which is useful when a dataset is sensitive. Because it runs in the browser, charts are built by hand from the data you supply rather than refreshed from a live source.
Highlights
- Map table columns to chart elements step by step
- Almost thirty chart models for comparisons and hierarchies
- Export charts as SVG or raster images
- Data is processed in your browser, according to the project
- Save projects to continue editing later