About Vega-Lite
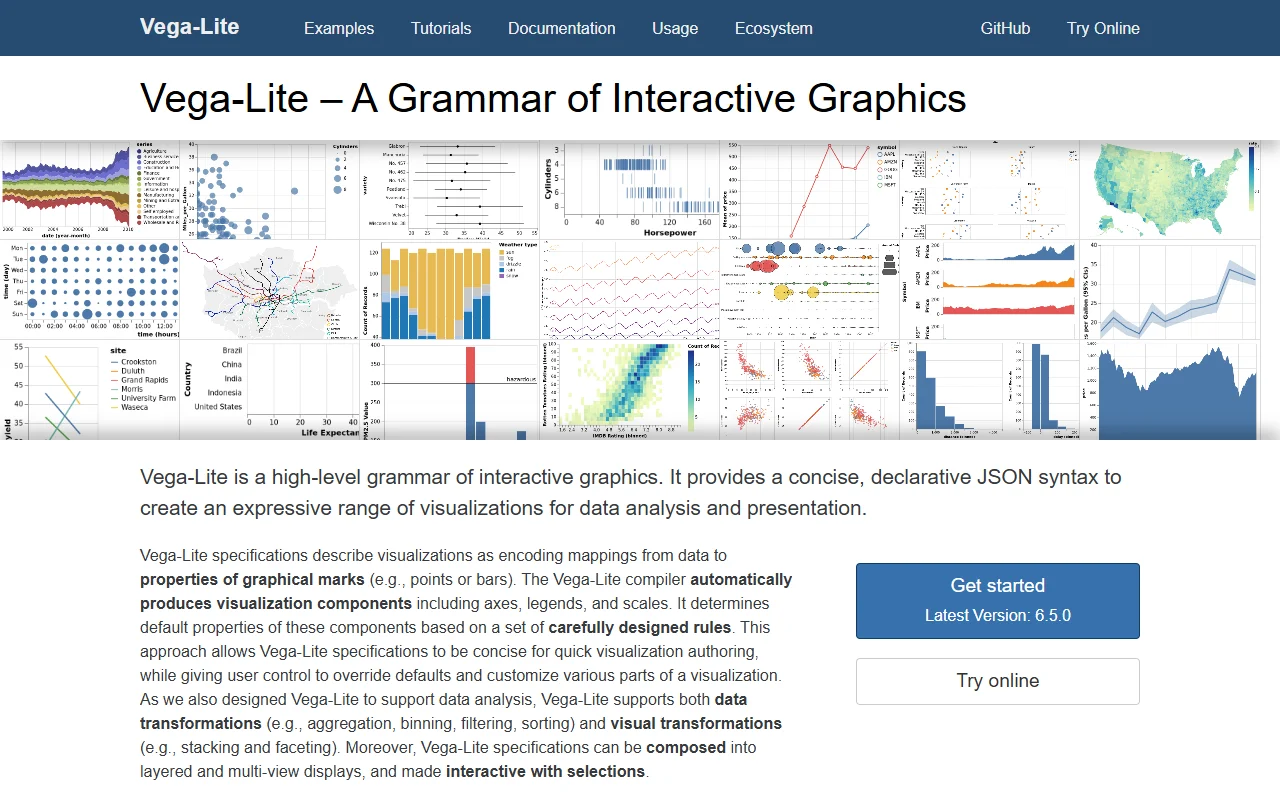
Vega-Lite is a high-level grammar for interactive statistical graphics. You describe a chart in concise JSON, and it compiles that into a full Vega specification.
What it does
You map data fields to visual channels such as position, color and size, and Vega-Lite creates axes, legends and scales with sensible defaults. It supports aggregation, binning, filtering and stacking. Layered and multi-view charts are possible, and selections make charts interactive.
Key features
- Concise JSON syntax for common chart types
- Automatic axes, legends and scales
- Data transforms such as aggregation and binning
- Layered and faceted multi-view displays
- Interactive selections for linked charts
Who it's for
Data analysts and developers who want to explore data quickly and prefer a declarative format. It suits notebooks and reports, and it can be a starting point for teams that later need more control.
Pricing and good to know
Vega-Lite is open source under the BSD-3-Clause license and free to use. You can try it online in the browser before installing anything. For advanced custom graphics, you can write in the lower-level Vega language.
Highlights
- Concise JSON syntax for common charts
- Automatic axes, legends and scales
- Aggregation, binning and filtering
- Layered and faceted multi-view charts
- Interactive selections for linked charts