About Chart.js
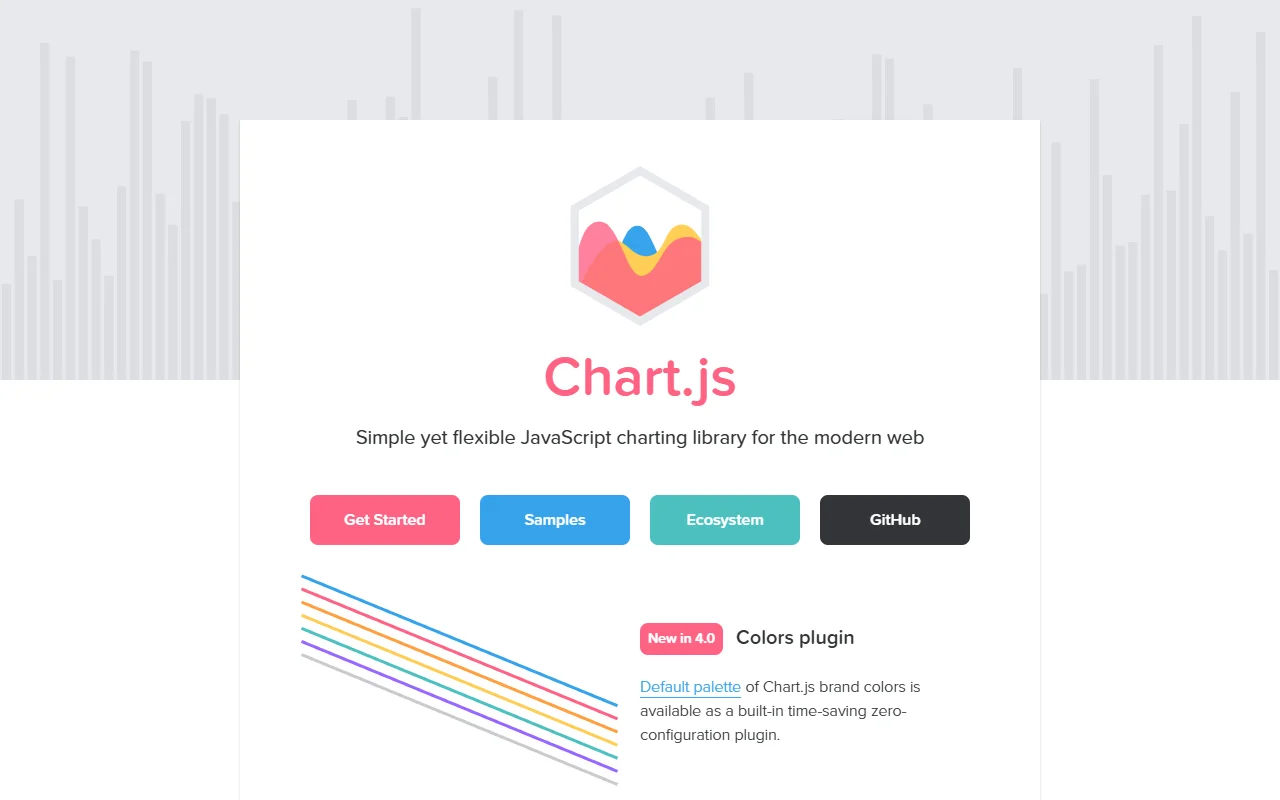
Chart.js is an open source JavaScript library for drawing charts on web pages. It uses the HTML canvas element to render bar, line and other chart types.
What it does
You pass Chart.js your data and options, and it draws an animated chart that resizes with the window. It supports mixed chart types, date and logarithmic axes, and custom scales. You can register only the components you need to keep the bundle smaller.
Key features
- Eight built-in chart types
- Mixed bar and line charts in one view
- Date, logarithmic and custom axis scales
- Animated transitions when data changes
- Tree-shaking to include only needed parts
Who it's for
Developers adding standard charts to dashboards, reports or marketing pages. It is a good fit when the chart types are common and you want a short learning curve.
Pricing and good to know
Chart.js is free and open source under the MIT license and is maintained by a community of contributors. It has no paid tier. Because charts are drawn on canvas, styling is set through the options rather than CSS. For very complex maps or 3D views, a specialist library may suit better.
Highlights
- Eight built-in chart types
- Mixed bar and line charts in one view
- Date, logarithmic and custom axis scales
- Animated transitions when data changes
- Tree-shaking to include only needed parts