About D3.js
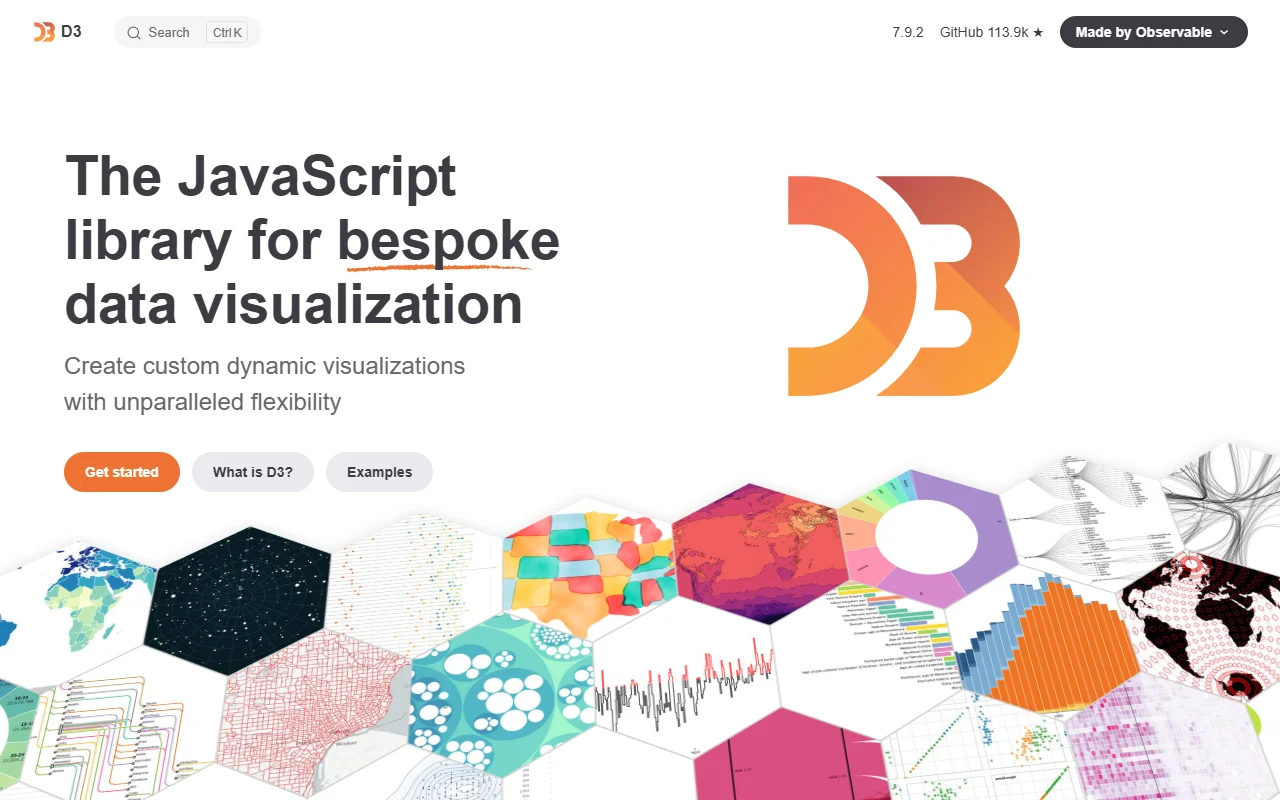
D3.js is a JavaScript library for building custom data visualizations in the browser. It binds data to elements on the page, and you control the result with standard web output such as SVG and HTML.
What it does
D3 provides helpers for selecting and updating page elements based on data, for mapping values to scales and axes, and for drawing shapes such as lines, areas and arcs. It also includes layouts for trees and networks, interactive behaviors such as zoom and drag, and geographic map projections.
Key features
- Scales and axes that map data to position
- Shapes for lines, areas, arcs and pie charts
- Layouts for trees, treemaps and force graphs
- Zoom, pan, brush and drag interactions
- Map projections for geographic data
Who it's for
Developers and data specialists who need charts that go beyond standard templates. Teams that want quick, conventional charts may prefer a higher-level tool, such as Observable Plot, which is built on D3.
Pricing and good to know
D3 is free and open source under the ISC license. It runs in the browser or in Node-based build tools. Because it is a low-level library, expect to write more code than you would with a ready-made chart component.
Highlights
- Scales and axes that map data to position
- Shapes for lines, areas, arcs and pie charts
- Layouts for trees, treemaps and force graphs
- Zoom, pan, brush and drag interactions
- Geographic map projections for location data