About Nivo
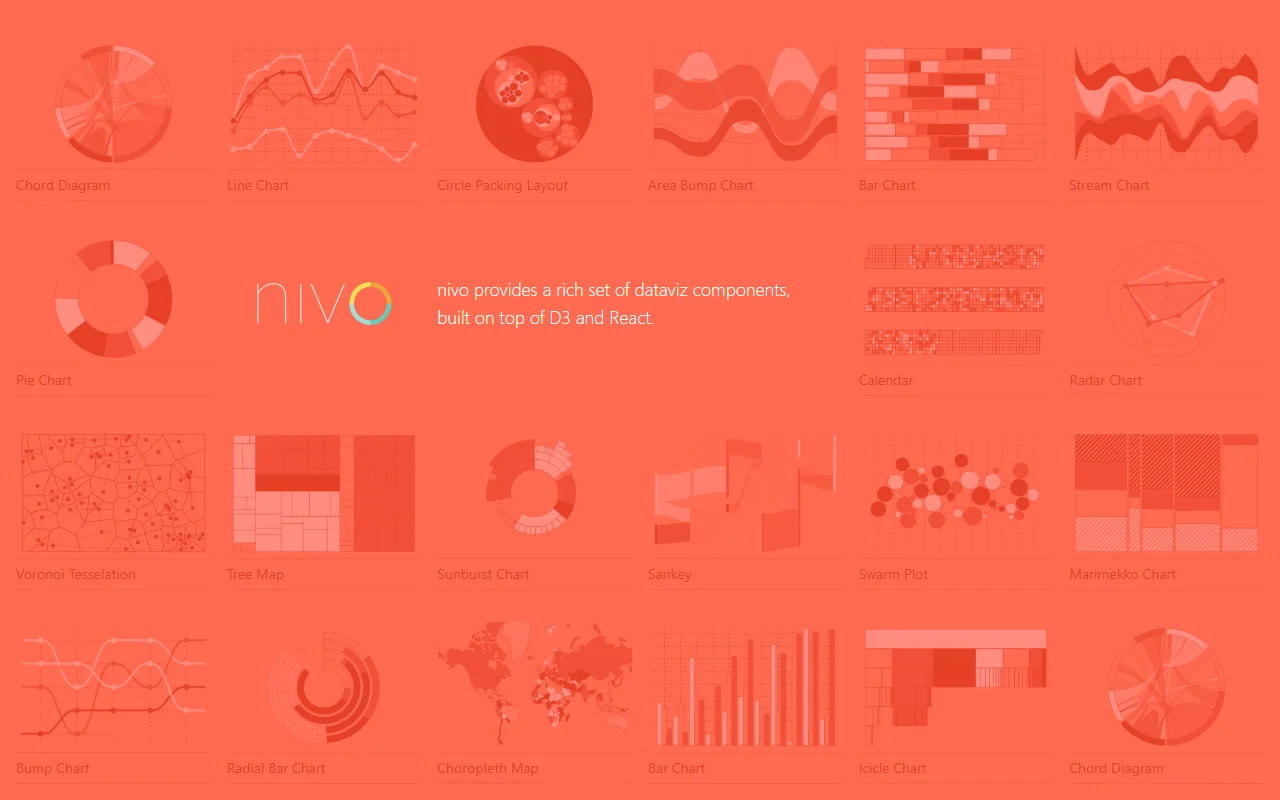
Nivo is a set of React components for data visualization, built on top of D3 and React. It covers many chart types beyond the usual bar and line charts.
What it does
Nivo gives you ready-made components for charts such as sankey diagrams, treemaps, sunbursts, calendar views, choropleth maps, chord diagrams and radar charts. Each component takes data and props, and you set themes and animations through configuration.
Who it's for
React developers who need unusual chart types, such as flow diagrams or hierarchical layouts, without writing the drawing code. It also suits teams that want a consistent visual style across many charts.
Pricing and good to know
Nivo is open source and released under the MIT license, so it is free to use. Because the components are built on React, you need React experience to adjust them. Some chart types are better suited to smaller datasets, so test performance with your own data.
Highlights
- Sankey, chord and treemap diagrams
- Calendar and radar chart components
- Choropleth maps for regional data
- Sunburst, icicle and circle packing layouts
- Bump, swarm and Marimekko charts