About Highcharts
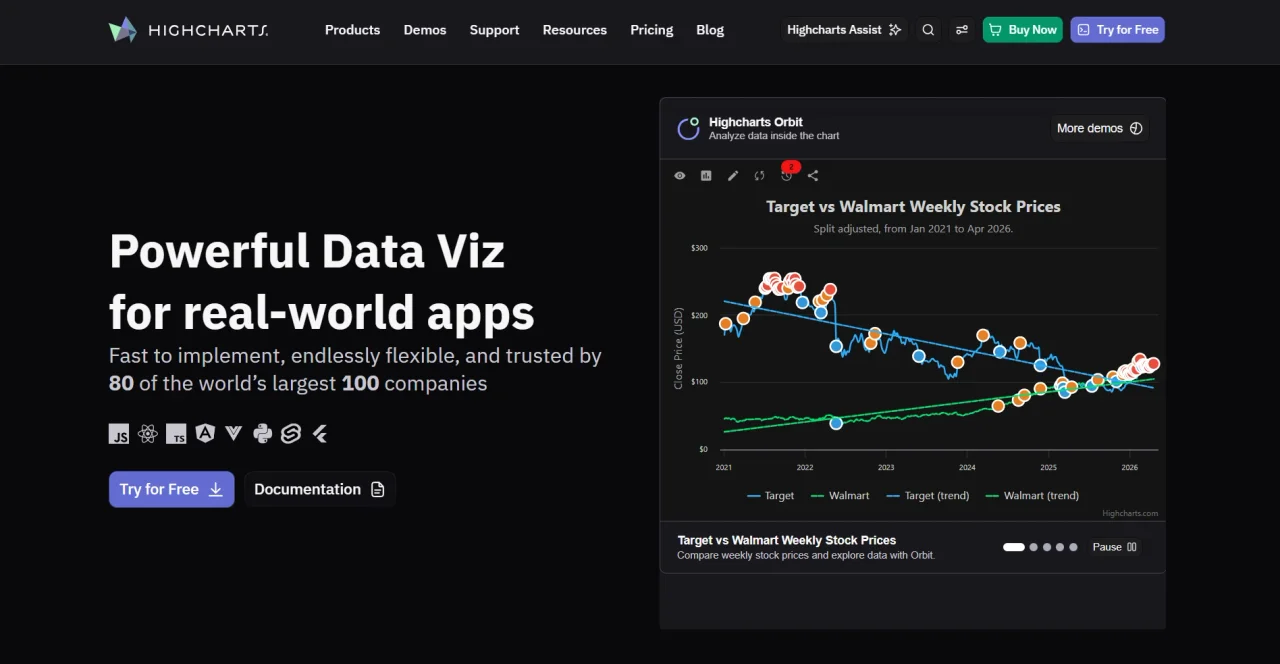
Highcharts is a JavaScript charting library for interactive charts, maps and dashboards. It is used in business applications and comes in separate packages for stock charts, maps, Gantt charts and grids.
What it does
Highcharts renders charts from your data and resizes them to fit their container. The product family includes Core, Stock, Maps, Gantt, Grid and Dashboards. It works with React, Angular, Vue, Svelte and plain JavaScript, and the site also lists Python and Flutter options.
Who it's for
Product teams and analysts building data-heavy apps, internal dashboards or reporting tools. It suits projects that need many chart types from one vendor.
Pricing and good to know
Highcharts offers a free trial, and the site shows a buy option after that. Check the vendor's licence terms before using it in a commercial product, since the terms depend on how you deploy it.
Highlights
- Core chart types for business data
- Stock charts for financial time series
- Maps and Gantt chart packages
- Grid and dashboard components
- Wrappers for React, Angular and Vue