About Uptrace
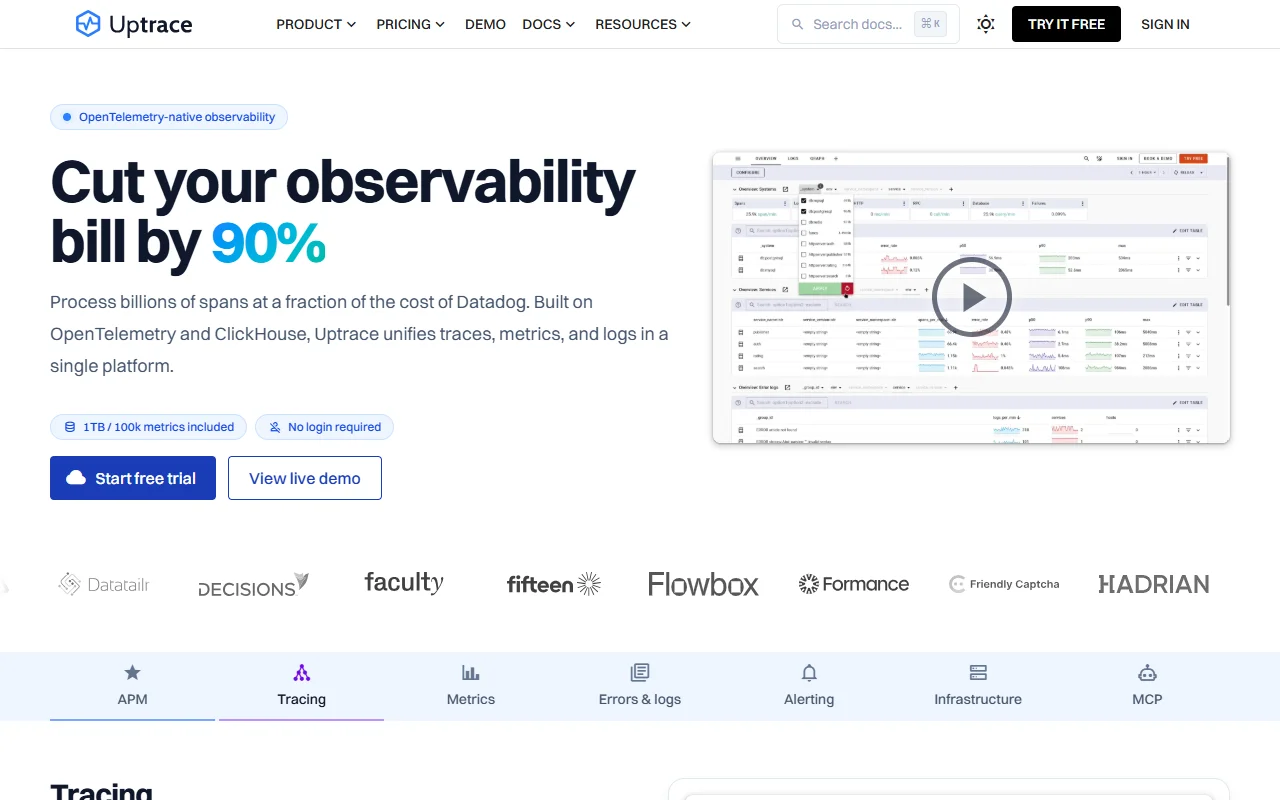
Uptrace is an observability tool built on OpenTelemetry that stores traces, metrics and logs together. It can be self-hosted for free or run as a managed cloud service.
What it does
Uptrace follows a request from start to finish across services, so you can see where time is spent and which step failed. It stores data in ClickHouse and offers a query language for filtering, grouping and aggregating traces, including very large traces. Alerts, infrastructure views and error tracking are part of the same interface. It can also act as a data source for Grafana's Tempo-compatible tracing, which helps teams that already use Grafana.
Key features
- End-to-end tracing across all services
- Query language for traces, metrics and logs
- Alerting on metrics and errors
- Ingest from OpenTelemetry, Prometheus and Fluent Bit
- Single sign-on with SAML or OIDC
Who it's for
Teams that already instrument their code with OpenTelemetry and want one tool for all three signals. Small engineering groups that want to avoid per-seat fees will also find the pricing model easy to reason about.
Pricing and good to know
The source code is available on GitHub under the AGPL-3.0 licence, and self-hosting is free with no feature limits. The managed cloud version is billed per gigabyte of ingested data and active time series, with a monthly cap that can be set. The page lists no per-seat fees and a free first month for the cloud service. On-premise installation is available for organisations that need it.
Highlights
- Trace view that follows a request across services
- Query language for traces, metrics and logs
- Alerts on metrics, errors and logs
- Ingest from OpenTelemetry and Prometheus
- Single sign-on through SAML or OIDC