About Dynatrace
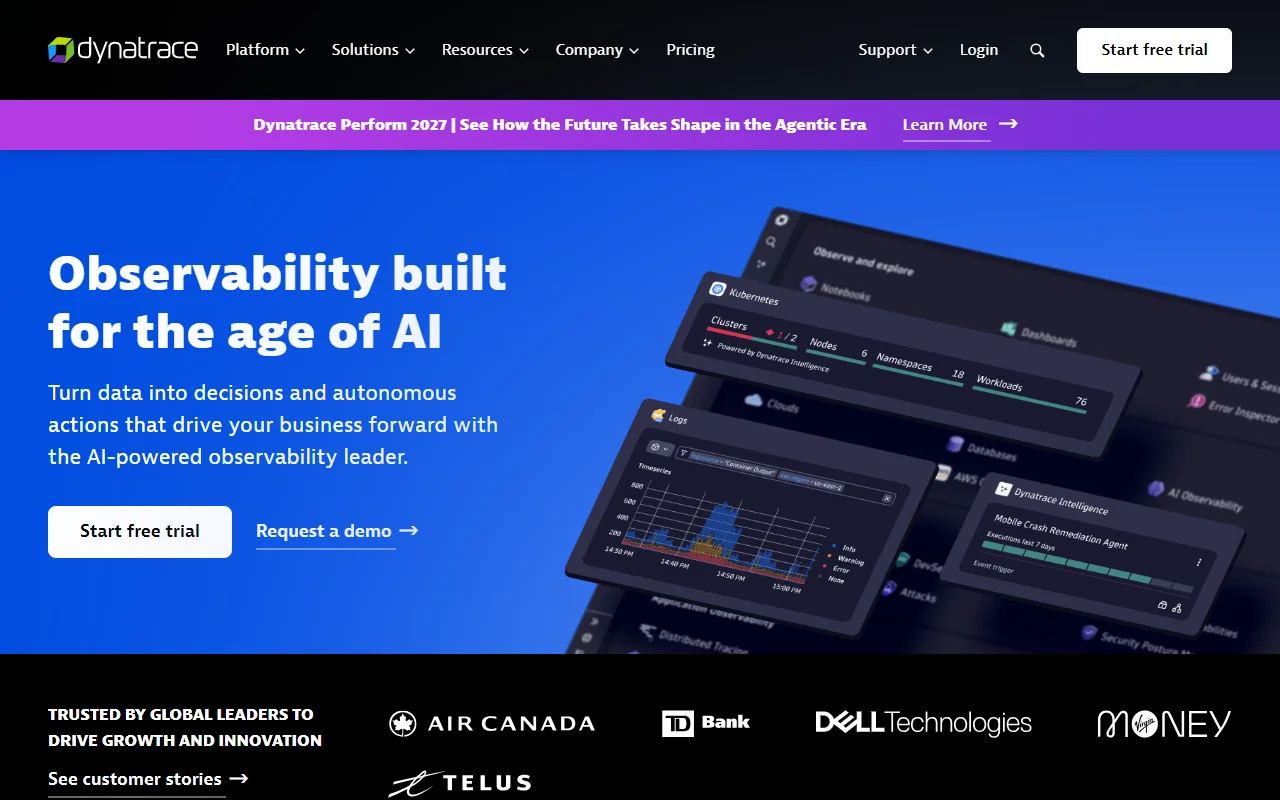
Dynatrace is a commercial observability platform aimed at large companies and engineering teams. It gathers data from applications, cloud infrastructure, logs and user sessions, then uses AI to help explain what is going wrong.
What it does
Dynatrace brings application performance, infrastructure health, log data and real user experience into one place. Its AI layer looks for unusual behaviour, predicts problems and traces the likely root cause of an incident, so teams can see what changed and where a fault began. It also includes security features that look for known and unknown vulnerabilities, and it can monitor generative AI applications, large language models and agents.
Key features
- Distributed tracing and profiling for application performance
- Infrastructure monitoring across several cloud environments
- Log analytics with a data lakehouse for search
- Real user and synthetic monitoring with session replay
- Monitoring for AI and LLM applications
Who it's for
This platform suits enterprise operations, site reliability and platform engineering teams that run complex, multi-cloud or highly regulated software. Security teams also use it to check risk in production systems alongside performance data.
Pricing and good to know
Dynatrace is a paid enterprise product. The website offers a free trial and a request-a-demo form, but no public price list appears on the page. It is offered as a hosted service, and the effort to set it up grows with the size of the environment being monitored.
Highlights
- Distributed tracing and profiling for applications
- Infrastructure monitoring across multiple clouds
- Log analytics and search on one data platform
- Real user monitoring with session replay
- Monitoring for generative AI and LLM apps