About Coroot
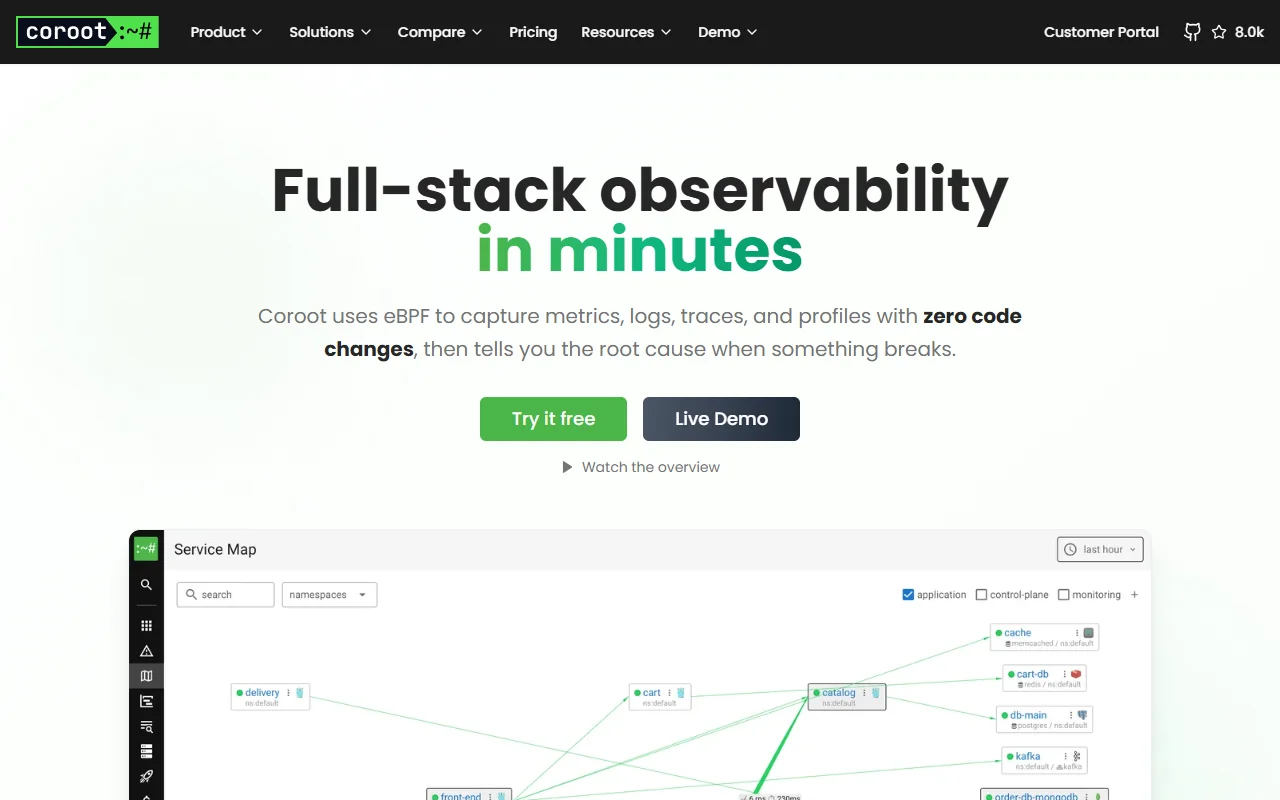
Coroot is an open source observability platform that uses eBPF to collect metrics, logs, traces and profiles without changes to application code. It also offers AI-assisted analysis that points to the likely cause of a problem.
What it does
Because data is gathered at the kernel level, Coroot can show applications, databases, infrastructure, cloud resources and network activity in one view. It stores and visualises the data, sends alerts, and builds a service map so you can see how components depend on each other. When something breaks, the AI analysis traces the dependencies, suggests a root cause and proposes a fix. Continuous profiling helps show which code paths use the most resources.
Key features
- Metrics, logs, traces and profiles with no code changes
- Service maps showing dependencies between components
- AI-guided root cause analysis
- Continuous profiling of running code
- Alerts and dashboards in one interface
Who it's for
Site reliability engineers and DevOps teams who want full visibility quickly, without instrumenting every service. Small teams that need to run their own monitoring stack will find the setup approach useful.
Pricing and good to know
The project is licensed under Apache-2.0 and the code is on GitHub, so it can be self-hosted. The site offers a free trial and a live demo, and it also lists a paid customer portal and a managed version. The eBPF approach depends on a reasonably recent Linux kernel on the machines being monitored.
Highlights
- Metrics, logs and traces without code changes
- Service maps of dependencies between components
- AI analysis that suggests root causes
- Continuous profiling of running code