
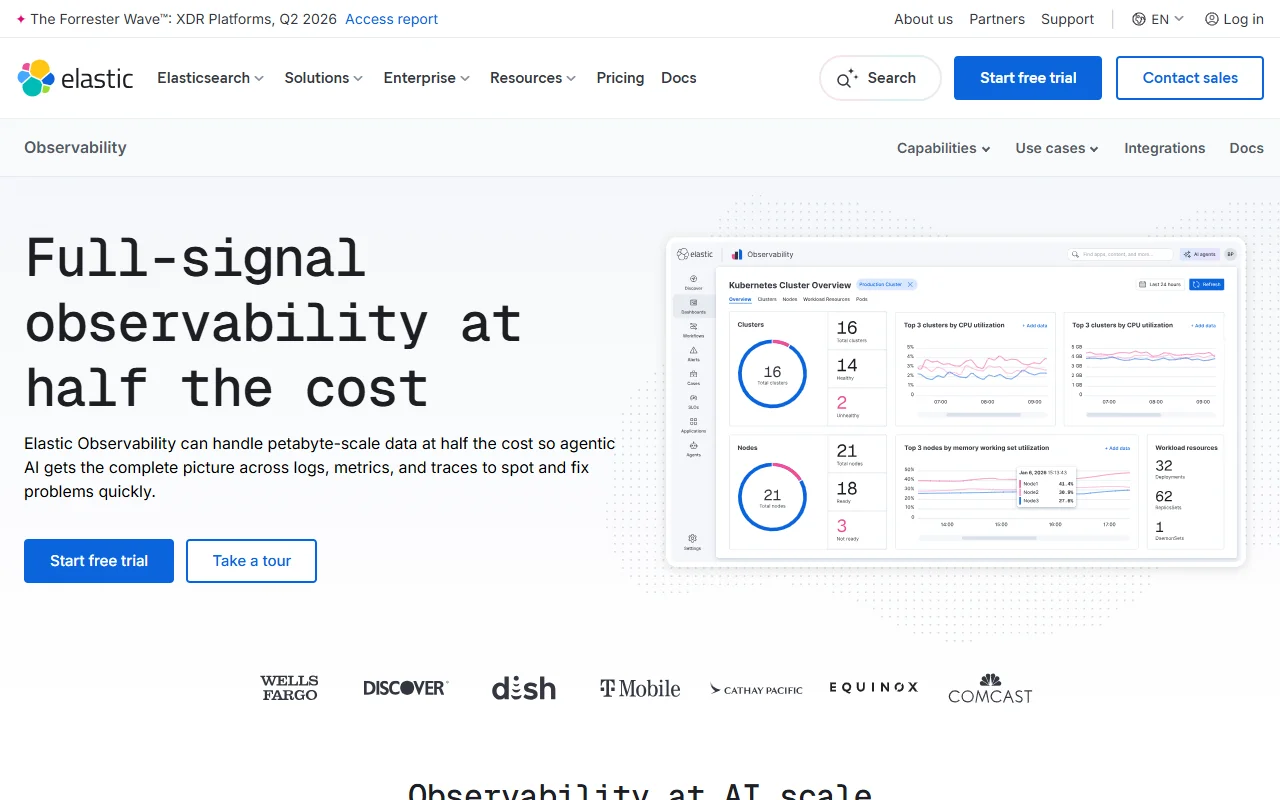
About Elastic Observability
Elastic Observability is a monitoring platform from Elastic that brings logs, metrics and traces into one place. It is built on Elasticsearch and is designed to search large volumes of telemetry quickly.
What it does
It collects logs, metrics and application traces from servers, containers, cloud services and applications. You can then search, chart and investigate them together. Machine learning features look for unusual patterns so teams can spot problems before they grow into incidents.
Key features
- Log analytics and search across large data sets
- Infrastructure monitoring for Kubernetes, hosts and cloud services
- Application performance monitoring with distributed tracing
- Anomaly detection with machine learning
- Ready-made integrations for many clouds and tools
Who it's for
Site reliability engineers, DevOps teams and platform engineers who already run large systems and want one place to look at their telemetry. Teams that follow OpenTelemetry or Prometheus standards will find the setup familiar.
Pricing and good to know
A free trial is offered, and larger deployments are arranged through the sales team. The platform covers many signals and options, so it takes some time to learn which parts you need first.
Highlights
- Log analytics and search across large data sets
- Logs, metrics and traces in one platform
- Infrastructure monitoring for Kubernetes and cloud services
- Anomaly detection with machine learning
- Over 500 one-click integrations with clouds and tools