
About Grafana
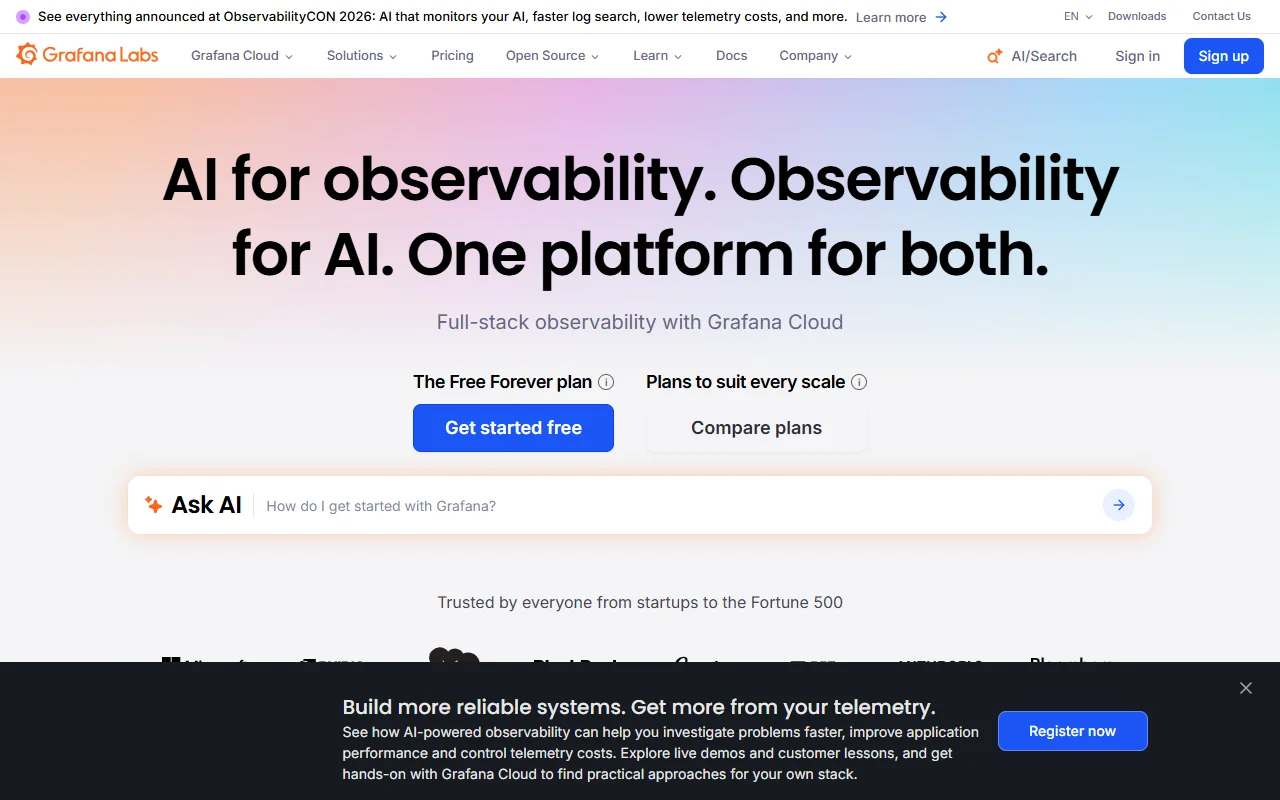
Grafana is an open source platform for building dashboards and exploring monitoring data. It connects to many data sources, and it is also offered as a hosted service called Grafana Cloud.
What it does
Grafana lets you draw charts and dashboards from metrics, logs and traces stored in other systems. You do not move the data into Grafana; it queries the sources where the data already lives. Teams can set alert rules on the same panels they use to watch their systems, which keeps monitoring and investigation in one view.
Key features
- Dashboards built from many different data sources
- One view for metrics, logs and traces
- Alerting rules that notify your team by chat or email
- Plugins that add new panels and data sources
- Hosted Grafana Cloud or a self-managed install
Who it's for
Grafana fits DevOps teams, platform engineers and anyone who runs a stack with several monitoring tools. Teams that want to avoid being tied to one vendor often choose it, because the code is open and the data sources use standard formats.
Pricing and good to know
The software is open source under the AGPL-3.0 license, so you can run it yourself at no license cost. Grafana Cloud offers a Free Forever plan, with paid tiers for larger use. Self-hosting means you manage upgrades, storage and access control on your own servers.
Highlights
- Dashboards built from many data sources
- One view for metrics, logs and traces
- Alerting rules that notify your team
- Plugins that add panels and data sources
- Hosted Grafana Cloud or self-managed installs