
About Prometheus
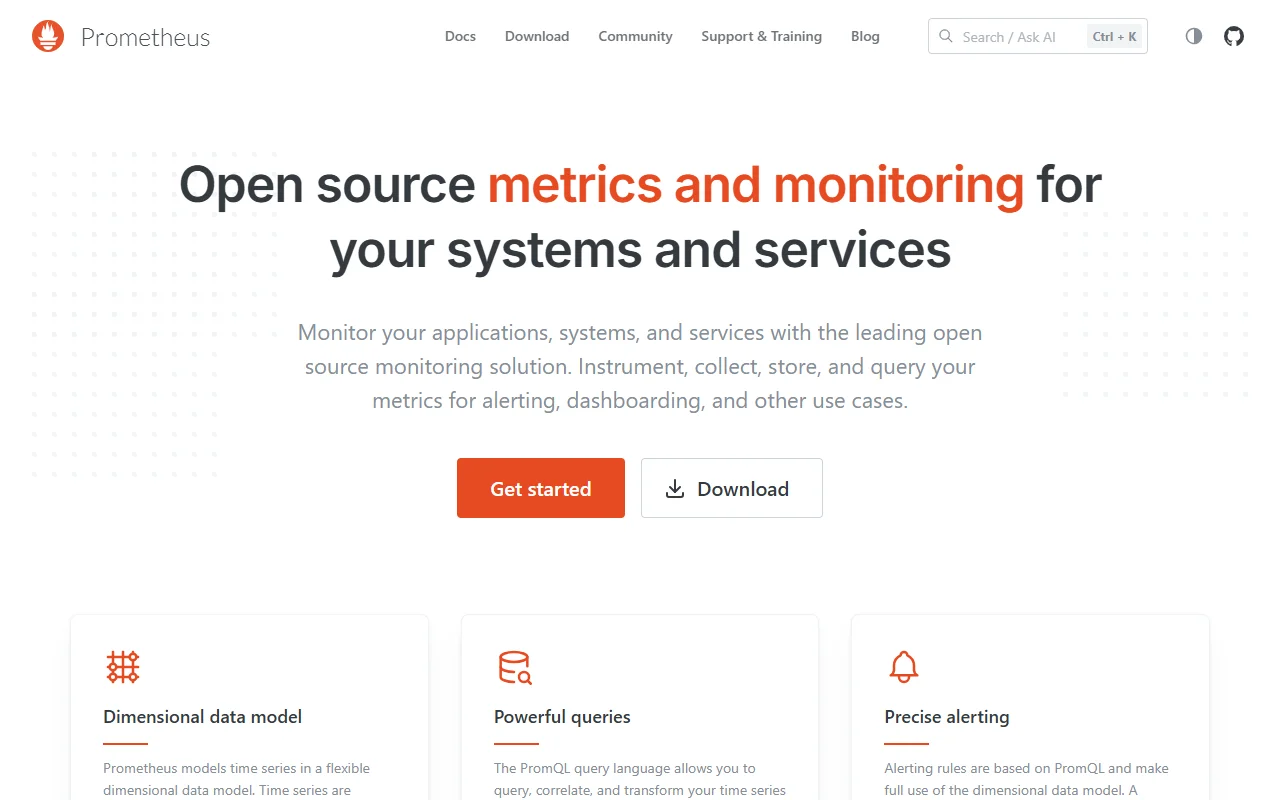
Prometheus is an open source monitoring system that stores metrics as time series. It was built for cloud native environments and includes its own query language, PromQL.
What it does
Prometheus collects numeric measurements from your applications, servers and services, usually by scraping an endpoint on a schedule. Each series is identified by a metric name and a set of key-value labels, which makes it easy to filter and group the data. Alerting rules run on the same data, and a separate Alertmanager component handles notifications and silences.
Key features
- Scrapes metrics from apps, servers and services
- PromQL for querying, combining and transforming series
- Alerting rules that use labels to target alerts
- Client libraries for most major programming languages
- Single binaries that are simple to deploy
Who it's for
Prometheus is a good fit for DevOps and platform teams that run containers or Kubernetes. It is also common in teams that want full control of their monitoring data without relying on a hosted service.
Pricing and good to know
Prometheus is free to download and run, and its code is available under the Apache 2.0 license. Each server stores data on local disk and works independently, so long retention or very large data sets may need extra tooling. It is often paired with Grafana for dashboards.
Highlights
- Scrapes metrics from apps, servers and services
- PromQL for querying and transforming time series
- Alerting rules that use labels to target alerts
- Client libraries for most major languages
- Single binaries that are simple to deploy