Skip to content

Chronosphere

Paid

Cloud native observability platform with cost controls for metrics

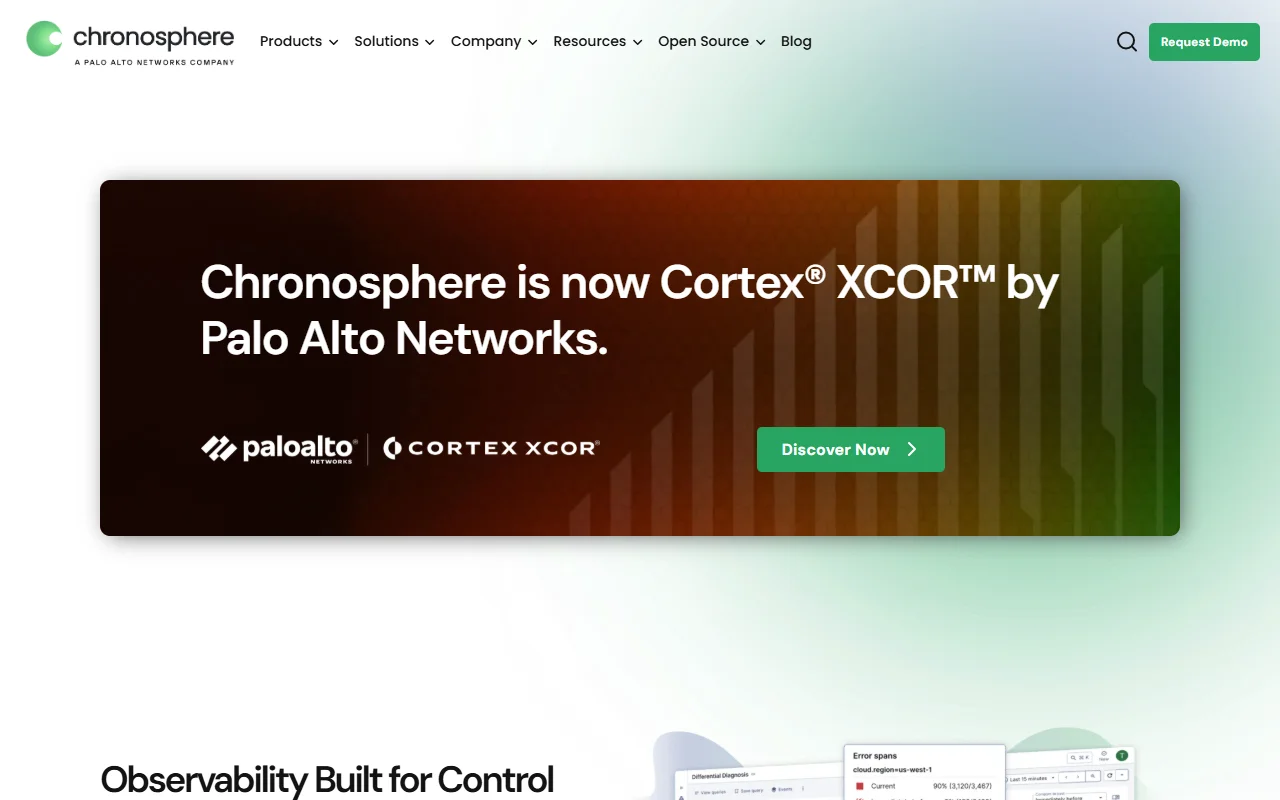
Chronosphere preview

About Chronosphere

Chronosphere is an observability platform built for cloud native systems such as microservices and containers. It collects metrics, traces and logs so engineers can find faults that affect customers.

What it does

The platform stores telemetry from services running on Kubernetes and similar environments. It lets teams decide which data is worth keeping, so they do not pay for signals nobody uses. Its AI features suggest likely root causes during an incident and recommend next steps, which can shorten the time spent working out what broke. A separate telemetry pipeline collects, transforms and routes data from many sources to many destinations.

Who it's for

Platform teams and site reliability engineers who run large container fleets are the main audience. Engineering managers who want to keep observability spending predictable may also find the cost controls useful.

Pricing and good to know

Pricing is not stated on the page, so a sales conversation or demo request is the usual route to a quote. The product is hosted, and the value depends on how much telemetry an organisation sends, so it is worth reviewing data volumes before a trial.

Highlights

  • Metrics and traces for container workloads
  • Choose which telemetry data to keep
  • Pipeline for collecting and routing telemetry
  • Suggested root causes during incidents
Ratings & reviews

Rate Chronosphere

Stars alone count straight away.0/300

Checking that you are human…

Was this page helpful?
Open source

Jaeger

Open source distributed tracing for microservice performance issues

Metrics and Tracing
Open source

InfluxDB

Time series database for high-resolution sensor and telemetry data

Metrics and Tracing
Open source

OpenTelemetry

Open standard and tools for collecting traces, metrics and logs

Tracing
Open source

Coroot

eBPF observability that finds root causes without code changes

APM Platforms
Open source

Zipkin

Distributed tracing system for finding latency in service calls

Metrics and Tracing
Open source

VictoriaMetrics

Open source time series database, compatible with Prometheus

Metrics and Tracing
Free trial

Elastic Observability

Logs, metrics and traces in one platform, built on OpenTelemetry

Logs and Search
Free trial

Rootly

Incident management and on-call tools that work in Slack and Teams

Containers & Infrastructure
Open source

Pixie

Open source Kubernetes debugging and observability with eBPF

APM Platforms
Open source

Apache SkyWalking

Open source observability for cloud-native systems and model calls

APM Platforms
Freemium

New Relic

Observability platform for applications, infrastructure and logs

Monitoring
Open source

Parseable

Open source logs, metrics and traces on object storage with SQL

Logs and Search