About Jaeger
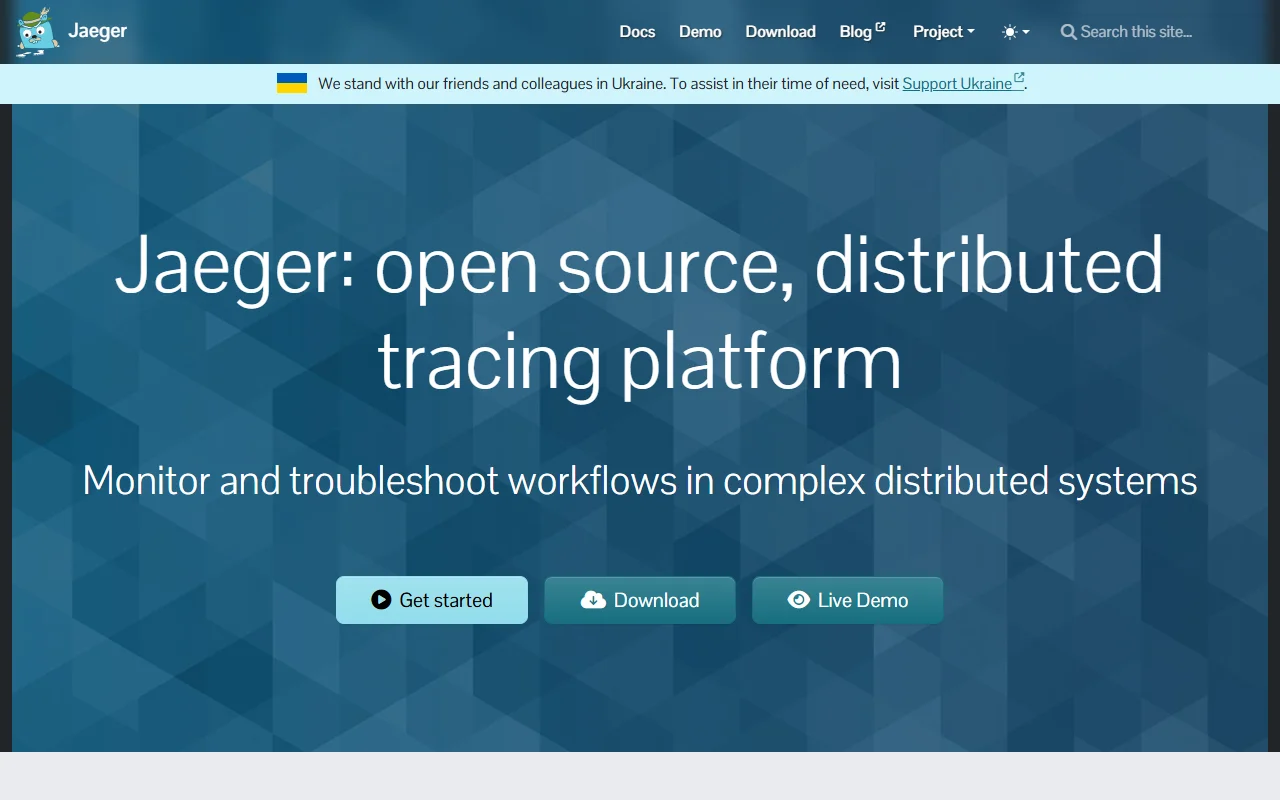
Jaeger is an open source distributed tracing platform for systems built from many services. It follows a request as it passes through each service, so you can see where time is lost or where an error starts.
What it does
Jaeger collects trace data from instrumented applications and shows each request as a timeline of calls across services. You can search traces, compare them and see how services depend on one another. Recent releases add ClickHouse as a storage backend.
Key features
- Trace search and per-request timelines
- Service dependency analysis
- Finding performance bottlenecks across services
- Native ClickHouse storage backend in recent releases
- Live demo available on the project site
Who it's for
Developers and operations teams who run microservices and need to follow requests across them. It is useful for teams that already use OpenTelemetry to collect telemetry.
Pricing and good to know
Jaeger is 100% open source under the Apache-2.0 license, and you run it on your own infrastructure. There is no vendor fee for the software. It needs a storage backend and some time to set up and tune for your traffic.
Highlights
- Trace search and per-request timelines
- Service dependency analysis
- Finding performance bottlenecks across services
- Native ClickHouse storage backend in recent releases
- Live demo available on the project site