About Our World in Data
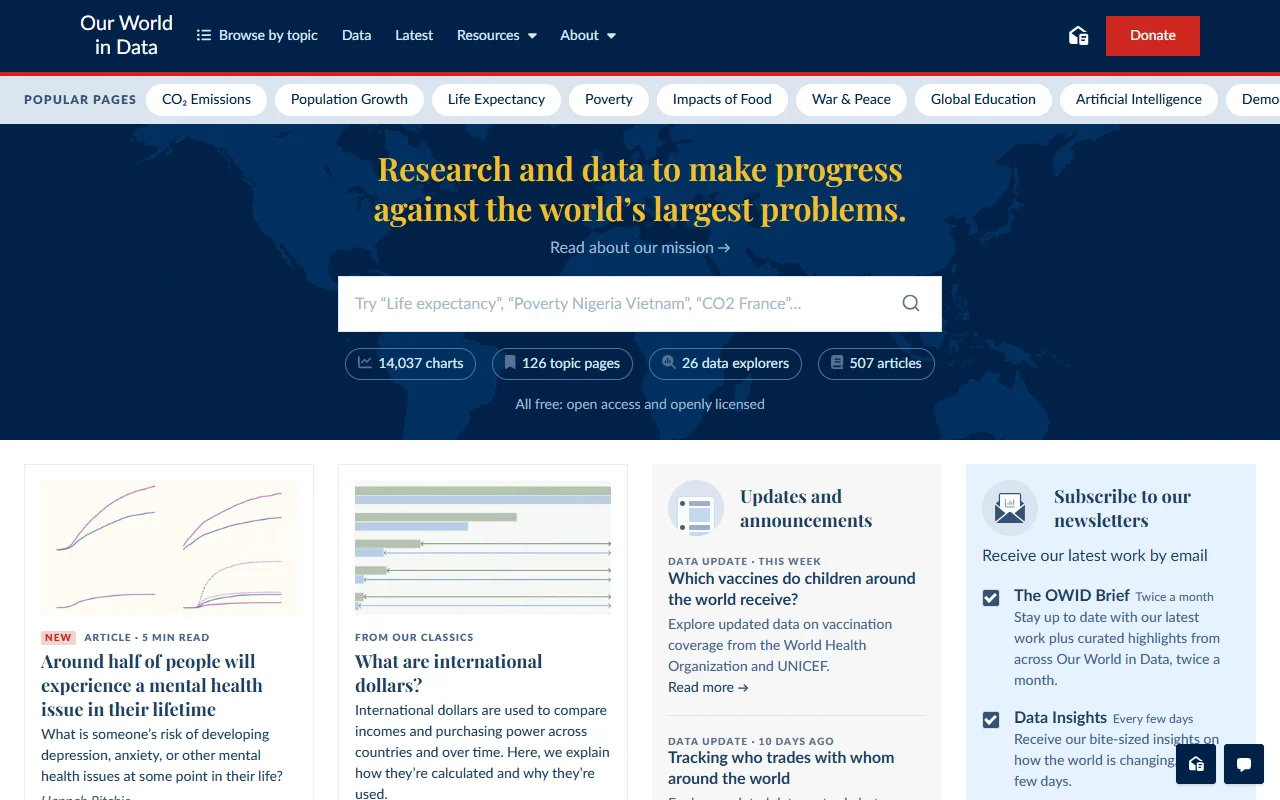
Our World in Data is a non-profit website that publishes research, charts and data on large global issues. It covers topics such as health, emissions, population and poverty.
What it does
The site collects data from many sources and presents it as charts and short explanatory articles. Each topic has a page that brings together the relevant graphs and written context. Visitors can use it to understand how conditions have changed over time and how different countries compare on the same measure.
Key features
- Interactive charts organized by topic
- Data explorers for comparing countries and years
- Articles that explain the data in plain language
- Openly licensed charts and data you can reuse
Who it's for
Students, teachers, researchers and writers who need reliable charts on global trends. It also suits anyone who wants a clear view of long-term change without paying for access to the material.
Pricing and good to know
The site is free to use and its content is open access. It is run as a non-profit and has a donate option for visitors who want to support the work. Data updates arrive at different times, depending on the source each chart uses, so check the date on a chart before quoting it.
Highlights
- Interactive charts organized by topic
- Data explorers for comparing countries and years
- Plain-language articles that explain the data
- Openly licensed charts and data you can reuse