
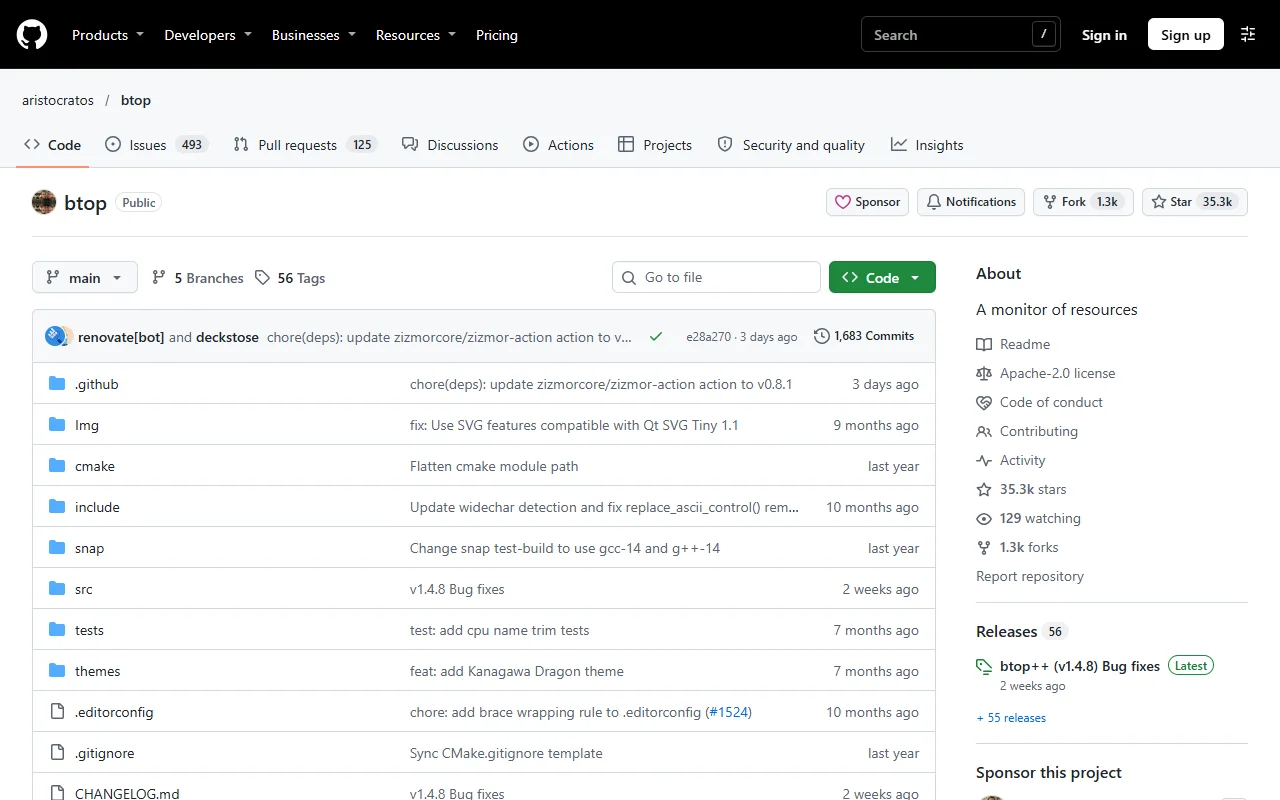
About btop
btop is an open source terminal resource monitor. It shows CPU, memory, disk, network and process activity in one screen.
What it does
btop draws a dashboard in the terminal with live graphs and tables for system resources. You can sort and filter processes and switch the color theme to suit your terminal. It is a quick way to check what is using a machine when it starts to slow down, and it works well over ssh.
Key features
- Live CPU, memory, disk and network graphs
- Process list with sorting and filtering
- Switchable color themes
- Mouse support in menus and panels
- Settings you can change in a config file
Who it's for
Developers, system administrators and anyone who runs servers over ssh and wants a readable overview of system load.
Pricing and good to know
btop is free and open source under the Apache-2.0 license, with source on GitHub. It builds for Linux, macOS and several BSD systems. Some graphics and sensor details depend on the hardware and operating system you run it on.
Highlights
- Live CPU, memory, disk and network graphs
- Process list with sorting and filtering
- Switchable color themes
- Mouse support in menus and panels
- Settings you can change in a config file