About Diagrams
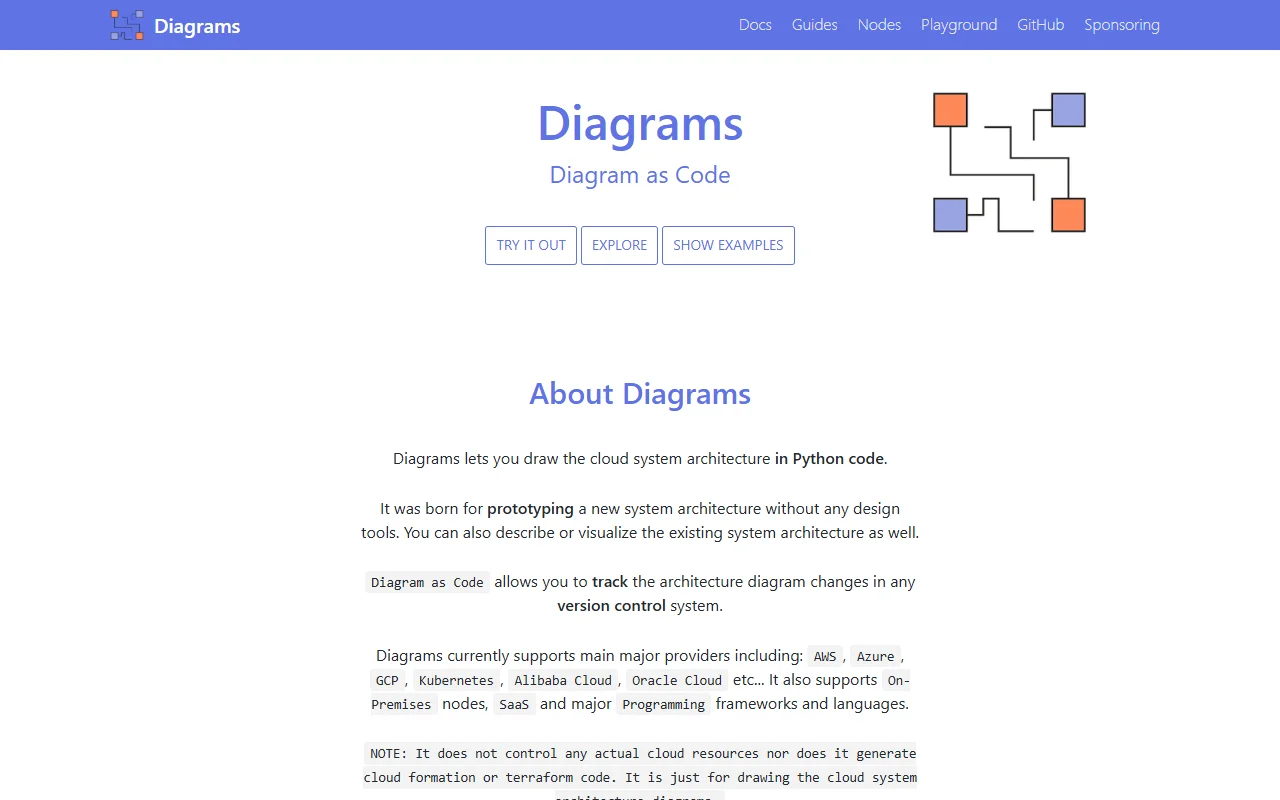
Diagrams is a Python library for drawing cloud system architecture diagrams in code. It is open source under the MIT license and is intended for planning and documenting systems.
What it does
You write a short Python script that places nodes for cloud services, on-premises systems and common frameworks, then render the result as an image. The library can also describe an existing system, not only a new design. Because the diagram is code, changes can be tracked in version control like any other change.
Key features
- Icons for AWS, Azure, GCP and Kubernetes
- Support for on-premises nodes and SaaS tools
- Diagrams generated from Python code
- Version control friendly source files
- Documentation with examples and node lists
Who it's for
Diagrams suits cloud engineers and solution architects who want reproducible architecture diagrams. It is a good match for people who already work in Python and want to prototype a system layout without opening a design tool.
Pricing and good to know
Diagrams is free and open source under the MIT license. It only draws diagrams. It does not control real cloud resources and does not generate infrastructure code. You need Python and the Graphviz tool installed to render images.
Highlights
- Icons for AWS, Azure, GCP and Kubernetes
- Support for on-premises nodes and SaaS tools
- Diagrams generated from Python code
- Source files that work with version control
- Examples and a list of available nodes